
March 2016 Weather and Its Impacts on Missouri
Pat Guinan
State Climatologist
University of Missouri Extension
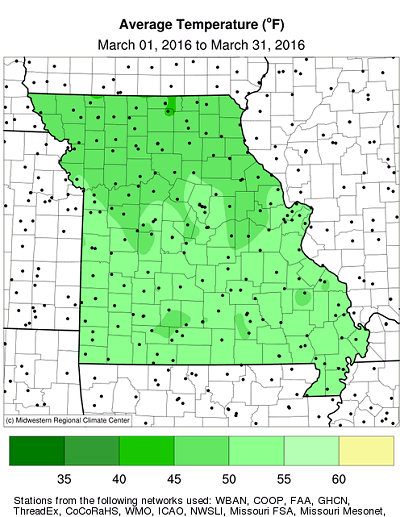
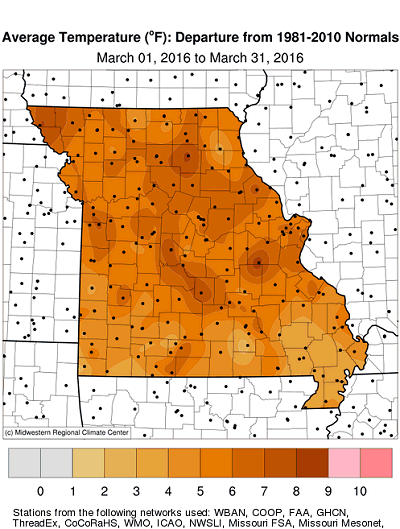
Mild March weather dominated the Show Me state with only a handful of days reporting cooler than normal temperatures, Figure 1. According to preliminary data, the statewide average temperature for the month was 50.2°F, or 6.6 degrees above normal. It was the 10th warmest March on record and the warmest since 2012, Figure 2. An anomalous warm trend has persisted for 7 consecutive months, Figure 3, and ranks as the 3rd warmest September through March period over the past 121 years, Figure 4.
A zonal to southwesterly upper air flow pattern occurred for much of the month, allowing few opportunities for northern cold air invasions. Coldest temperatures were reported across most of the state during the first couple days of March. Lowest minimum temperatures in early March ranged from the teens and lower 20s. Minimum temperatures in the Missouri Bootheel were generally in the mid to upper 20s. The lowest official temperature was 13°F, and reported in Green City, MO (Sullivan county) on the morning of March 2. There were scattered reports of ornamental and peach and apple freeze damage in parts of central and southern Missouri when minimum temperatures dipped into the 20s on March 19, 20, 21 and 25. A guide to spring frost/freeze probabilities for Missouri can be accessed at the following link:
Missouri Frost Freeze Probabilities Guide
http://ipm.missouri.edu/frostfreezeguide/
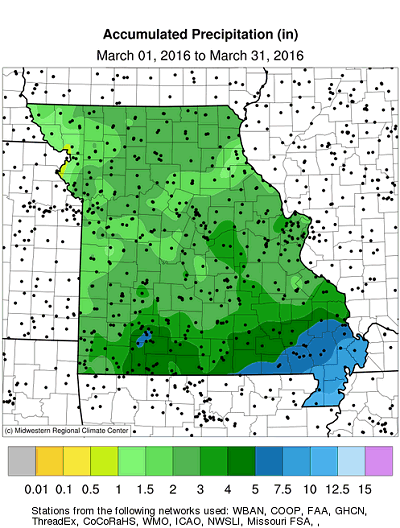
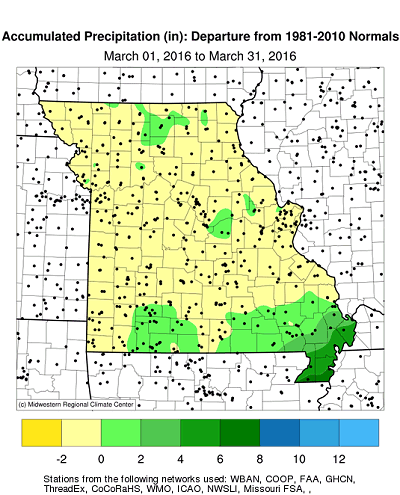
With the exception of far southeastern sections and a few isolated pockets around the state, March precipitation was below average across Missouri. Preliminary data indicated a statewide average of 2.90 inches, or 0.38" below the long-term average. It was the third consecutive month of below average precipitation, Figure 5, making it the driest Jan-Mar period since 2014 and the 16th driest Jan-Mar period on record, Figure 6. The extended period of dry weather in Missouri was reflected in the Drought Monitor map released at the end of March, when abnormally dry conditions (D0) were introduced across a significant portion of the state, Figure 7. A dry start to the year has no bearing on the type of weather patterns that set-up during the growing season in Missouri.
Lowest March precipitation totals occurred in northwestern Missouri, in Buchanan and Andrew counties, where CoCoRaHS observers near St. Joseph and Savannah reported 0.79" and 0.80", respectively. The highest March precipitation totals were found across far southern sections of Missouri where 4-6 inches were common. Heaviest reports were confined to the Bootheel with several locations reporting more than 7-inches. CoCoRaHS and NWS Cooperative observers in Dunklin and Pemiscot counties reported the highest monthly totals including Caruthersville (9.84"), Kennett (9.96") and Hornersville (10.74"). There were no major winter weather events during the month.
Jump to:
- Figure 1
- Figure 2
- Figure 3
- Figure 4
- Figure 5
- Figure 6
- Figure 7
- Figure 8
- Figure 9
- Figure 10
- Figure 11
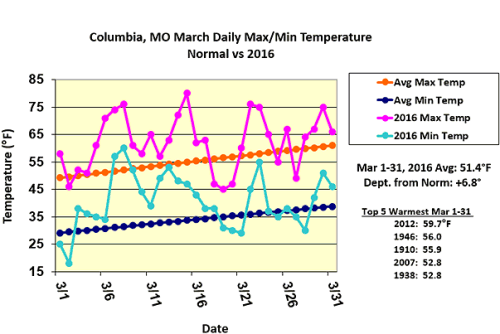
Figure 1.
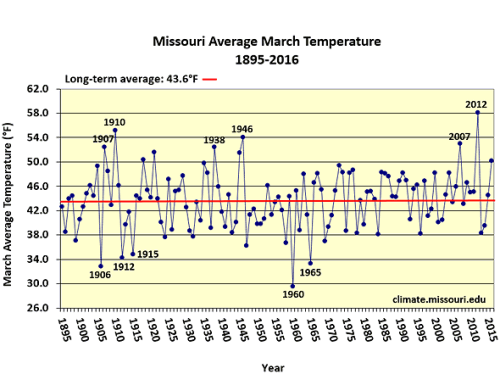
Figure 2.
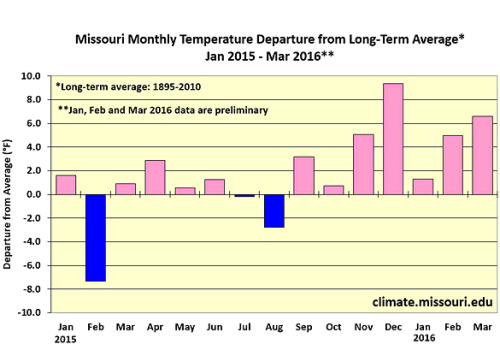
Figure 3.
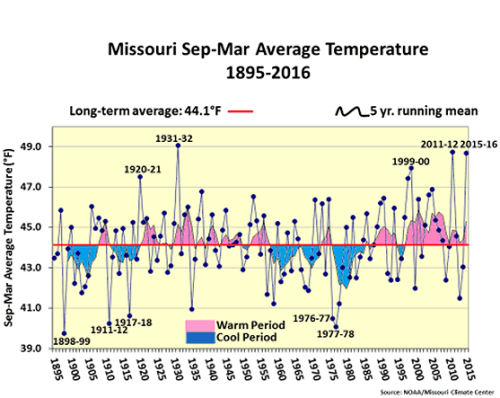
Figure 4.
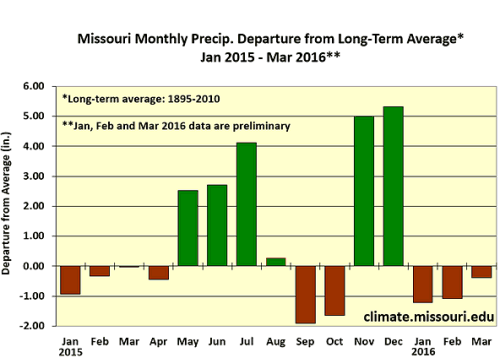
Figure 5.
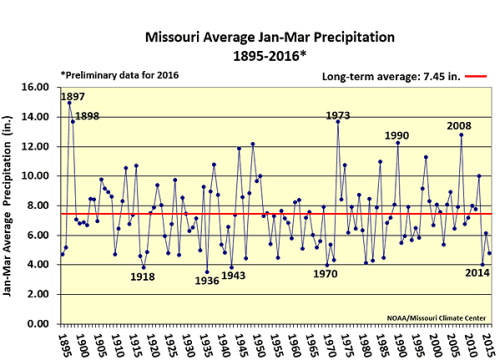
Figure 6.
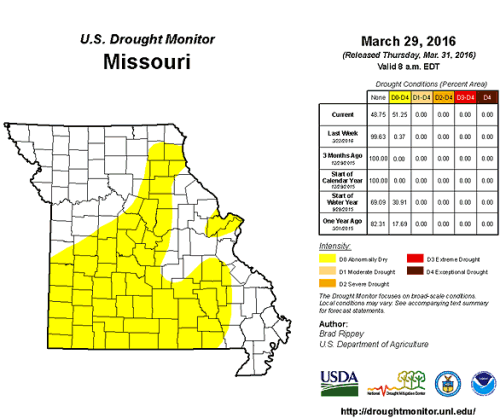
Figure 7.
Source: Pat Guinan, 573-882-5908