
July 2015 Weather and Its Impacts on Missouri
Pat Guinan
State Climatologist
Commercial Agriculture/University of Missouri Extension
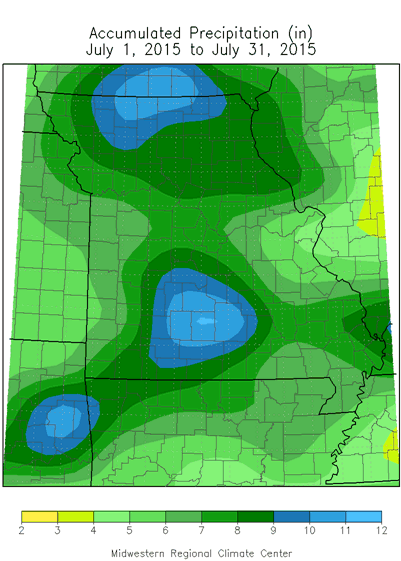
Wet conditions impacted all of Missouri during July in what has become an exceptionally wet growing season for the state, Figure 1. Preliminary rainfall data indicate a statewide monthly average of 7.84 inches, which ranks as the 4th wettest July on record, and the wettest July since 1993, Figure 2.
Most locations received 5 or more inches during July with some counties over northern, central and southern Missouri reporting more than 10 inches, Figure 3. Table 1 shows some of the heaviest reports around the state. Some locations observing the lowest monthly totals include Arnold 1N (3.59"), Steelville 5.6SW (3.80"), Kennett 0.8N (3.89"), and Des Peres 1.0NNE (4.01").
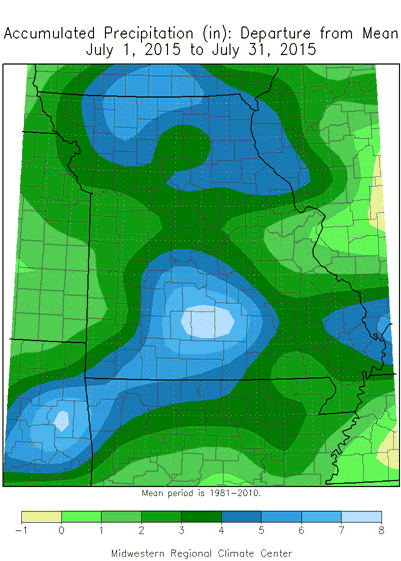
Since May 1, a persistent wet weather pattern locked itself over Missouri resulting in one of the wettest May through July periods on record, Figures 4 and 5. Preliminary data indicate this year to be the 2nd wettest May-July on record (22.41", +9.17", 169% of normal), just shy of the record 22.55 inches in 1981. The established wet weather pattern translated to an above average number of days with measureable rainfall over the past 3 months, Table 2.
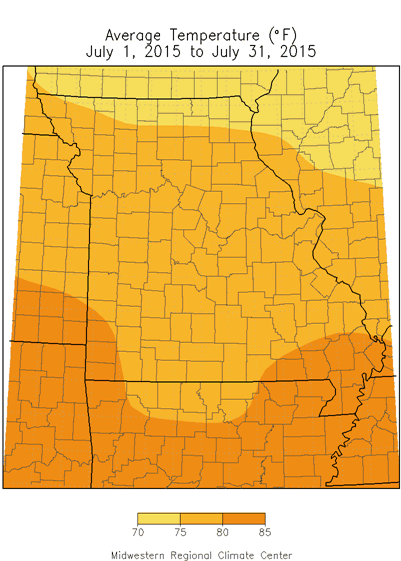
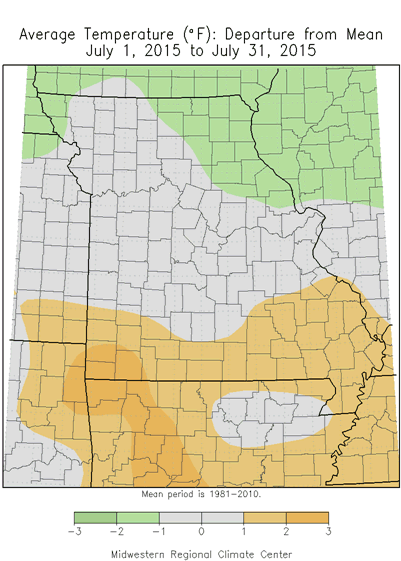
July temperatures were seasonable this year, but conditions were uncomfortable during the month due to summer heat and high humidity. The antecedent wet conditions contributed toward higher summer dew points, similar to several high heat index days experienced in 2010 and 2011. The statewide average temperature for the month was 77.5°F, or -0.1° below normal, Figure 6. The slightly cooler than normal weather broke a 4-month string of above average warmth this year, Figure 7.
The persistent wet growing season posed major challenges for farmers this year including planting crops, cutting hay, flooded fields, nutrient loss, diseases and other factors. Other impacts include delayed construction and transportation projects, water in basements, flash flooding, prolonged waterlogged vegetation, etc. The last time we've seen an entire growing season with no drought stress for any part of Missouri was 2009.
Additionally, the wet period this spring and summer has resulted in prolonged high water levels in lakes, rivers and streams. These conditions have sadly contributed to more drowning deaths than usual. The Missouri State Highway Patrol has reported 34 drownings this year, while 25 were reported in all of 2014. Most of the fatalities have been attributed to flooding.
According to the Climate Prediction Center, temperature and precipitation outlooks for August indicate below normal temperatures and above normal rainfall for Missouri.
Jump to:
- Figure 1
- Figure 2
- Figure 3
- Table 1
- Figure 4
- Figure 5
- Table 2
- Figure 6
- Figure 7
- Figure 8
- Figure 9
- Figure 10
- Figure 11
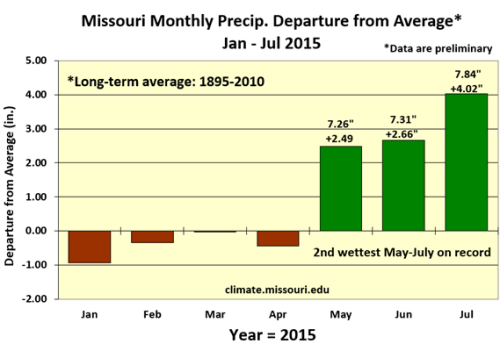
Figure 1.
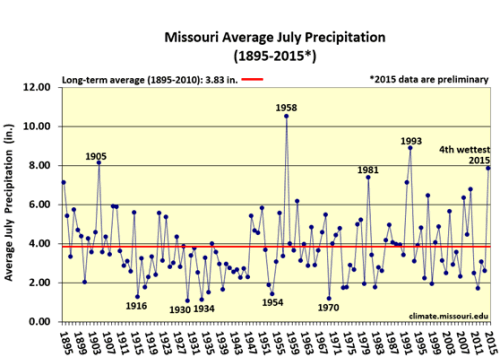
Figure 2.
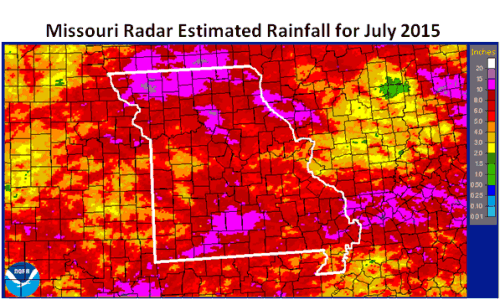
Figure 3.
| Station Name* | County | July 2015 Precip (in) |
| Princeton 1.4NNE | Mercer | 15.37 |
| Houston 4.5ESE | Texas | 15.02 |
| Conception Junction 0.3SE | Nodaway | 14.86 |
| Cassville 4.8SSE | Barry | 14.69 |
| Parnell 3.3ESE | Worth | 14.59 |
| Ozark 1.6SE | Christian | 14.51 |
| Hartville 0.8WSW | Wright | 14.48 |
| Ava 6.0NW | Douglas | 14.36 |
| Maryville 4.0ESE | Nodaway | 14.36 |
| Stanberry 4.4NNE | Gentry | 14.33 |
| *Rain gauges are from the NWS Cooperative Network or CoCoRaHS | ||
| Table 1. | ||
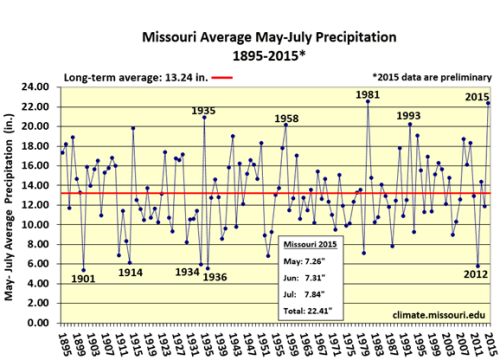
Figure 4.
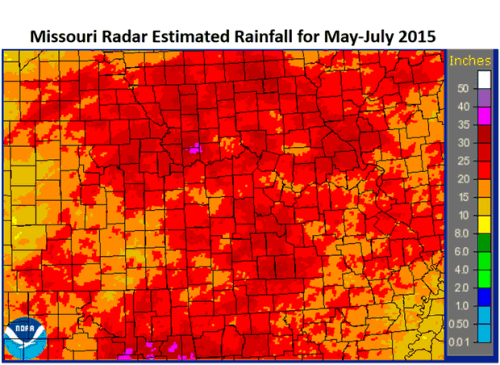
Figure 5.
| Number of days with precipitation ≥ 0.01 inches | |||||||||
| May 2015 |
May Normal* |
June 2015 |
June Normal* |
July 2015 |
July Normal* |
May-July 2015 |
May-July Normal* |
||
| Kansas City | 21 | 12 | 14 | 11 | 13 | 9 | 48 | 32 | |
| Columbia | 16 | 13 | 17 | 10 | 9 | 9 | 42 | 32 | |
| St. Louis | 14 | 12 | 17 | 10 | 10 | 9 | 41 | 31 | |
| Springfield | 18 | 12 | 10 | 11 | 11 | 8 | 40 | 31 | |
| *Normal: 1981-2010 | |||||||||
| Table 2. | |||||||||
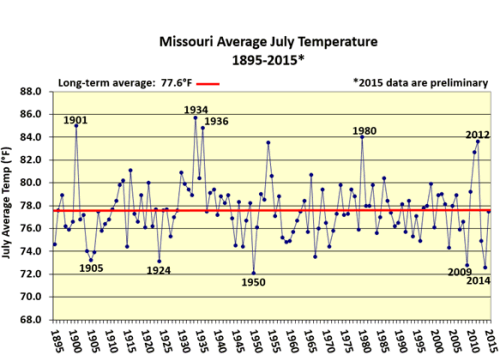
Figure 6.
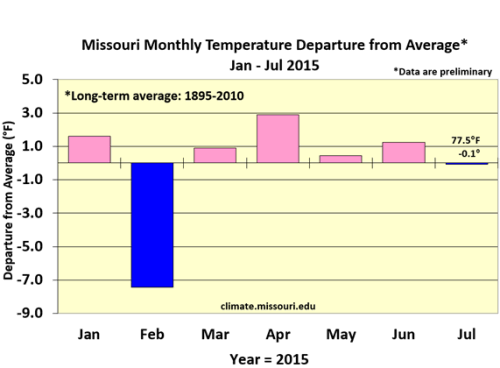
Figure 7.
Source: Pat Guinan, 573-882-5908