
June 2015 Weather and Its Impacts on Missouri
Pat Guinan
State Climatologist
Commercial Agriculture/University of Missouri Extension
The wet May conditions spilled into June for much of Missouri and resulted in one of the wettest May-June periods in decades. Preliminary rainfall data for Missouri indicate a statewide average June total of 7.50 inches, ranking it the 9th wettest June on record, and the wettest June since 1981, Figure 1. This year the statewide rainfall average approached 15-inches for the combined May-June period. It was wettest May-June since 1995 and ranked as the 5th wettest May-June on record, Figure 2. There have been only 6 drier than average May-June periods since 1995, highlighting the wet spring trend Missouri has experienced over the past couple decades.
Heaviest June precipitation, in excess of 10-inches, fell over much of northeastern, east central and west central Missouri, Figure 3. A few locations reported more than 15 inches for the month, Table 1, including the community of Troy, MO, which reported 20.15 inches for June, about half the annual normal. Alternatively, portions of far southeastern Missouri, especially in the Bootheel, reported below normal rainfall for the month. Row crop irrigation was ongoing in the region where some locations reported less than 2-inches for June, including Malden (1.76") and Charleston (1.77").
There were numerous widespread heavy rain events across the state that led to significant flooding and flash flooding. Many rivers and streams overflowed their banks and remained above flood stage for much of the month. Remnants of an early season tropical system, Tropical Storm Bill, spiraled through the southeastern half of the state on June 18-19, Figure 4. On June 19th, the James River, in southwestern Missouri, broke a flood mark record going back more than 100 years. Two flash flood related fatalities were reported in June, one in Washington county and another in Moniteau county.
The frequency of rain events in May and June were unusually high and limited fieldwork opportunities for farmers. Table 2 illustrates the anomaly comparing average number of days with precipitation greater than or equal to 0.01" to the number of days this year for four locations in the state. Figure 5 shows total radar estimated precipitation that fell in May-June, with several counties in east central and west central Missouri receiving more than 20 inches. According to the Missouri Agricultural Statistics Service, 62% of the soybean crop had been planted as of June 28, well below the 5-year average of 94%. The persistent soggy conditions created challenges for row crops with flooded fields, nutrient loss and disease vulnerability, Figures 6-8. Wheat harvest and haying opportunities were also limited.
Preliminary data indicate the average statewide temperature for June was 74.4°F, or 1.4 degrees above the long-term average. It was the 4th consecutive month with above normal temperatures, Figure 9. Regionally, northeast Missouri averaged 1 degree above normal with northwestern, central and southeastern sections averaging 1-2 degrees warmer than average. Southwestern Missouri averaged 2-3 degrees above normal for the month. June has averaged above normal for 10 out of the past 11 years in Missouri, Figure 10.
Using Columbia, Missouri as a midpoint for the state, Figure 11 shows cool conditions for the first few days transitioning to a warm period during the second week, and alternating warm and cool weather over the latter half of the month. There were also extended cloudy periods, which is indicative of the above normal daily minimum temperatures that dominated.
Dry, hot conditions in the western U.S. and Canada led to a spike in wildfire activity in June. Satellite animations during the last week of June revealed plumes of smoke being transported along the jet stream from Alberta, Canada through the Dakotas and Minnesota into Iowa and Missouri, Figures 12. The sun rays filtered through the smoke and resulted in colorful sunrises and sunsets for a few days, Figure 13.
Three short-lived tornadoes were reported in east central Missouri on June 28th when severe thunderstorms impacted the area. An EF-0 (80 mph) and EF-1 (100 mph) tornado were reported in Pike county, near the village of Eolia, and an EF-2 (122 mph) tornado was documented in northern St. Charles county, 4 miles northwest of St. Peters. Some property and tree damage were reported, but fortunately no injuries.
Jump to:
- Figure 1
- Figure 2
- Figure 3
- Table 1
- Figure 4
- Table 2
- Figure 5
- Figure 6
- Figure 7
- Figure 8
- Figure 9
- Figure 10
- Figure 11
- Figure 12
- Figure 13
- Figure 14
- Figure 15
- Figure 16
- Figure 17
Figure 1.
Figure 2.
Figure 3.
| Table 1 | ||
| Station Name* | County | June 2015 Precip (in) |
| Troy | Lincoln | 20.15 |
| Kirksville | Adair | 18.28 |
| Cap AU GRIS L&D 25 | Lincoln | 17.75 |
| Monticello 0.4 SSW | Lewis | 17.38 |
| Troy 1.2 NNE | Lincoln | 17.24 |
| Edina | Knox | 16.84 |
| Middletown 3.5 SW | Montgomery | 16.82 |
| New London 0.9 SSW | Ralls | 16.33 |
| Kirksville 1.4 S | Adair | 16.02 |
| Martinsburg 2.2 NNE | Montgomery | 15.67 |
| Kahoka 0.6 S | Clark | 15.17 |
| Edina 2.3 E SSW | Knox | 15.09 |
| *Rain gauges are from the NWS Cooperative Network or CoCoRaHS | ||
Figure 4.
| Table 2: Number of days with precipitation ≥ 0.01 inches | |||||||
| May 2015 | May Normal* | June 2015 June | Normal* May-June | 2015 May-June | Normal* | ||
| Kansas City | 21 | 12 | 14 | 11 | 35 | 23 | |
| Columbia | 16 | 13 | 17 | 10 | 33 | 23 | |
| St. Louis | 14 | 12 | 17 | 10 | 31 | 22 | |
| Springfield | 18 | 12 | 10 | 11 | 28 | 23 | |
| *Normal: 1981 - 2010 | |||||||
Figure 5.
Figure 6. Flooded corn in Gasconade county, MO. Photo: Dave Martner
Figure 7. Flooded yellow corn in Monroe county, MO. Photo: Linda Geist.
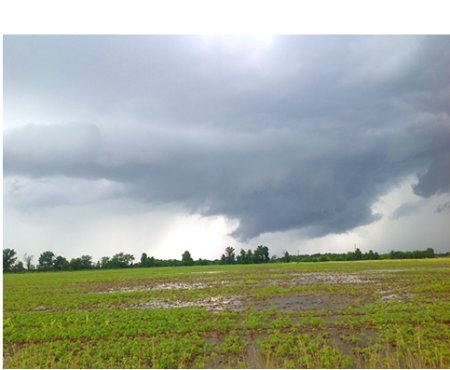
Figure 8. Flooded soybean field in Monroe county, MO with wall cloud in background. Photo: Linda Geist
Figure 9.
Figure 10.
Figure 11.
Figure 12. Smoke plume extending from western Canada into the central U.S. NOAA visible satellite picture taken June 29, 2015 at 6:45 p.m. CDT
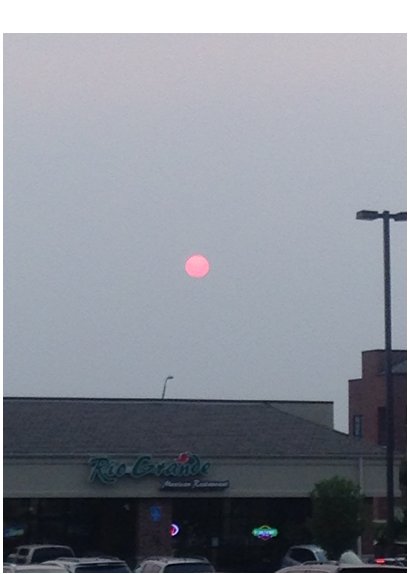
Figure 13. Sun obscured by wildfire smoke from Alberta, Canada. Columbia, MO, 8:04 p.m. CDT, June 28, 2015. Photo: Pat Guinan
Source: Pat Guinan, 573-882-5908