
June 2016 Weather and Its Impacts on Missouri
Pat Guinan
State Climatologist
University of Missouri Extension
Statewide preliminary temperature data for Missouri indicates June 2016 will rank in the top 10 warmest Junes on record, similar to warmth experienced in 2010. The month will likely rank 9th warmest June since 1895, Table 1. The statewide average temperature was slightly above 77°F, more than 4 degrees above the long-term average. The last time June averaged cooler than normal was 2004, Figure 1. For the northern half of Missouri, it was the warmest June in decades. St. Joseph, Kansas City, Columbia and St. Louis recorded their warmest June since 1953. The mercury climbed into the 90's on a majority of days, with only a few days reporting below normal temperatures. Columbia broke a June record for reaching the 90's on 19 consecutive days, June 9-27, Figure 2.
| Top 10 Warmest Junes for Missouri Period of Record: 1895-2016 | ||
| Year | Avg Temp (�F) | |
| 1. 1952 | 80.0 | |
| 2. 1953 | 79.7 | |
| 3. 1934 | 79.7 | |
| 4. 1914 | 78.8 | |
| 5. 1911 | 78.5 | |
| 6. 1933 | 77.6 | |
| 7. 1901 | 77.5 | |
| 8. 2010 | 77.3 | |
| 9. 2016 | 77.2* | |
| 10. 1918 | 76.6 | |
| *preliminary data for 2016 | ||
| Table 1. | ||
Preliminary precipitation data indicated a statewide average June total of 2.5 inches, or a little more than 2 inches below the long-term average. It was the driest June since 2012, Figure 3.
Rainfall was variable across the state with heaviest amounts reported across parts of northwestern and north central Missouri and southwestern and south central sections, where 3-4 inches were common. Lightest monthly totals ranged from 1-2 inches, and were typical over northeastern and east central sections and portions of central and southeastern Missouri. Pockets of extreme dryness, where less than 0.50 inches fell for the month, were located across far northeastern Missouri, and extended southward to the St. Louis area. A couple other pockets of extreme dryness were located around Kansas City and Cape Girardeau. By the last week of June, more than half of Missouri was experiencing abnormally dry to moderate drought conditions according to the Drought Monitor map, Figure 4. Some of the highest and lowest June rainfall totals are listed in Table 2.
| Highest June 2016 Rainfall | ||
| Location | County | June 1-30 Rainfall (in.) |
| 1. Gallatin 1W | Daviess | 8.24 |
| 2. Alton 1.7NNW | Oregon | 7.04 |
| 3. Albany 0.7NE | Gentry | 6.74 |
| 4. Brookline 2.3NNW | Greene | 6.66 |
| 5. Bolivar1.0NE | Polk | 6.06 |
| Lowest June 2016 Rainfall | ||
| Location | County | June 1-30 Rainfall (in.) |
| 1. Monticello 0.4SSW | Lewis | 0.08 |
| 2. Edina 2.3E | Knox | 0.19 |
| 3. Palmyra 1.0W | Marion | 0.40 |
| 4. Platte City 0.3ENE | Platte | 0.43 |
| 5. Bloomfield 2.9S | Stoddard | 0.48 |
| Table 2. | ||
An unusual number of sunny days occurred in June across Missouri. Columbia, MO recorded 21 mostly sunny days and two cloudy days during the month, Figure 5. The high temperatures and cloud-free days contributed toward higher than usual daily potential evapotranspiration rates. Potential evapotranspiration, or PET, is the amount of water lost due to evaporation from a well-watered soil surface and transpired from plants. Figure 6 shows the estimated amount of daily PET from irrigated turf grass during June 2016 in mid-Missouri compared to the 5-year average. Antecedent dry soil moisture conditions, much below normal June rainfall and high daily PET rates for the month resulted in vegetative stress for parts of Missouri and was evidenced by brown lawns and curling corn. Figure 7 shows two pictures taken on the University of Missouri campus 3 weeks apart, and is indicative of the deteriorating lawn conditions due to water stress. Figures 8 and 9 show a lawn picture taken on campus, and curling corn just southeast of Columbia, respectively. Columbia experienced its 6th driest January through June since records began (1890), and driest first-half of the year in 24 years, Figure 10.
According to the Missouri Agricultural Statistics Service, by the last week of June, 51% and 39% of the topsoil and subsoil moisture supplies, respectively, were in short to very short condition in the state. Corn was rated mostly fair to good at 82%, and soy conditions were mostly fair to good at 86%. Pasture conditions were in mostly fair to good condition at 89%. The majority of hay and stock water supplies were adequate.
Jump to:
- Figure 1
- Figure 2
- Figure 3
- Figure 4
- Figure 5
- Figure 6
- Figure 7
- Figure 8
- Figure 9
- Figure 10
- Figure 11
- Figure 12
- Figure 13
- Figure 14
Figure 1.
Figure 2.
Figure 3.
Figure 4.
Figure 5.
Figure 6.
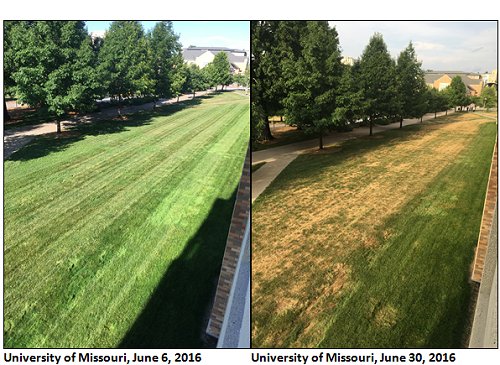
Figure 7.
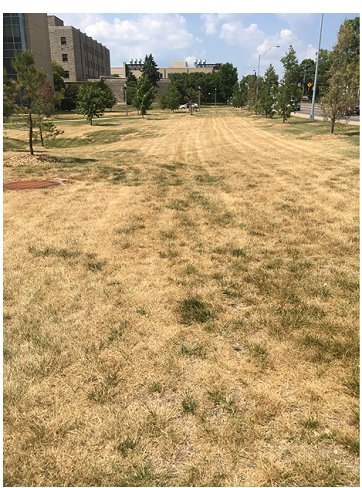
Figure 8. University of Missouri, Rollins and College Avenue,
Columbia, MO, June 20, 2016
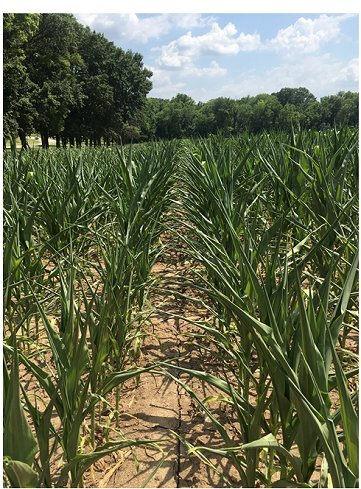
Figure 9. South Farm Research Center,
Columbia, MO, June 20, 2016
Figure 10.
Source: Pat Guinan, 573-882-5908