June 2023 Weather and Its Impacts on Missouri
Dr. Pat Guinan
Climatologist
Extension Associate Professor Emeritus
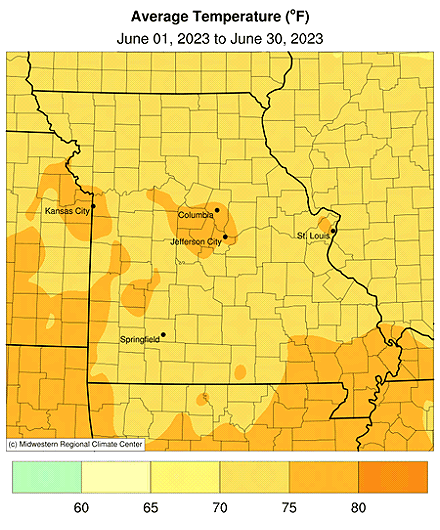
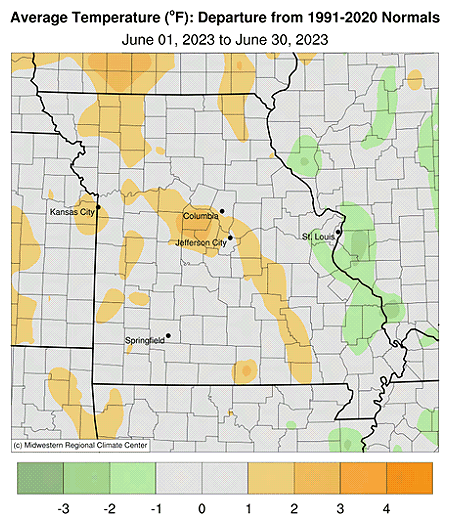
Above average daily maximum temperatures were prevalent in Missouri during June with seasonably cool daily minimum temperatures, Figure 1. Preliminary data indicate a statewide average monthly temperature of 73.9°F, or 0.9 degrees above the baseline average (1901-2000). The warmer than average temperatures followed the trend over the past several years, where only one June since 2005 has been below average, Figure 2. It was also the sixth warmer than average month for the year, Figure 3.
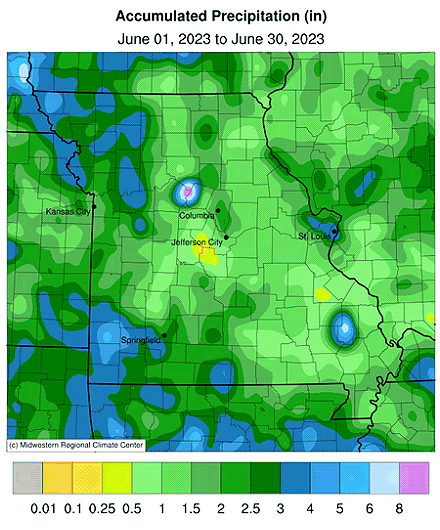
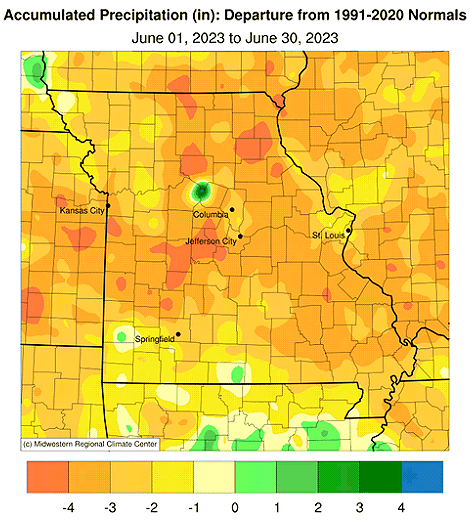
Dry conditions expanded and intensified in June and producers remained concerned since critical corn growth stages were approaching and pasture and water supplies were dwindling. According to radar estimates, monthly rainfall was less than 2-inches for many locations, Figure 4. Much of the eastern half of Missouri received less than 2-inches, with far northwestern locations experiencing higher totals, between 3-5 inches. A sizeable portion of southeastern Missouri reported less than 25% of normal rainfall for the month, Figure 5.
The statewide average rainfall total was 1.89 inches, 2.73 inches below the baseline average (1901-2000), Figure 6. It was the 6th driest June on record for Missouri and driest June since 1988. It was the third consecutive month with below average precipitation, Figure 7, and the 4th driest April through June period on record for Missouri, Figure 8. Some of the heaviest and lightest June rain gauge totals are listed in Tables 1 and 2.
| Highest June 2023 Rainfall (in) - NWS Coop and CoCoRaHS reports | ||
| Location | County | June 1-30 |
| Tarkio #2 | Atchison | 5.20 |
| Carthage 4.5E | Jasper | 5.15 |
| St. Louis Science Center | St. Louis City | 4.98 |
| Pleasant Hill 1.0NNW | Cass | 4.82 |
| Warrensburg 1.1NNE | Johnson | 4.67 |
| Albany 0.7NE | Gentry | 4.61 |
| Golden City 0.6SSW | Barton | 4.59 |
| Pierce City 5.0NE | Lawrence | 4.52 |
| St. Charles 7.0SSW | St. Louis | 4.51 |
| Tecumseh 2.2SE | Ozark | 4.48 |
| Table 1. | ||
| Lowest June 2023 Rainfall (in.) - NWS Coop and CoCoRaHS reports | ||
| Location | County | June 1-30 |
| Dexter 2.3W | Stoddard | 0.25 |
| Ste. Genevieve 0.5S | Ste. Genevieve | 0.30 |
| Sikeston 1.7ENE | Scott | 0.31 |
| Iberia | Miller | 0.40 |
| Bismarck 1.3S | St. Francois | 0.43 |
| Houston 4.5 ESE | Texas | 0.43 |
| Eugene 4.8NE | Cole | 0.49 |
| Shelbyville 5.5NNW | Shelby | 0.53 |
| Winona 3.0SW | Shannon | 0.54 |
| Potosi 3.2W | Washington | 0.55 |
| Table 2. | ||
Dry June conditions exacerbated the ongoing drought situation in Missouri. According to the U.S. Drought Monitor, much of northern and central Missouri were experiencing severe to extreme drought by the end of the month, Figure 9. Drought was widespread with 82% of the state in some level of drought.
According to the Missouri Agricultural Statistics Service, for the week ending June 25, 3% of corn was silking compared to a 5-year average of 5%. Soybean was 93% emerged, compared to a 5-year average of 79%. Topsoil moisture supplies were rated 12% adequate, 43% short, and 45% very short, while subsoil moisture was rated at 19% adequate, 40% short and 41% very short. Corn condition was rated mostly fair at 44%, 29% good, 16% poor, 9% very poor and only 2% excellent. Soybean was reported at 41% fair, 30% good, 19% poor, 8% very poor and only 2% excellent. Pasture conditions were dismal and rated mostly poor at 55%, 26% fair, 13% very poor and only 6% good. The majority of hay supplies and other roughages were reported very short at 42%, 38% short and 20% adequate. Stock water supplies were mostly short at 54%, 11% very short and 35% adequate.
Jump to:
- Figure 1
- Figure 2
- Figure 3
- Figure 4
- Figure 5
- Figure 6
- Figure 7
- Figure 8
- Figure 9
- Figure 10
- Figure 11
- Figure 12
- Figure 13
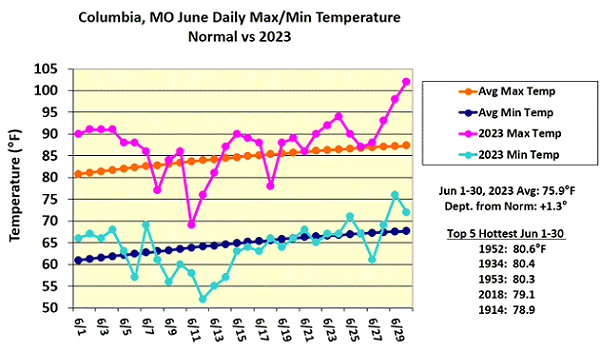
Figure 1.
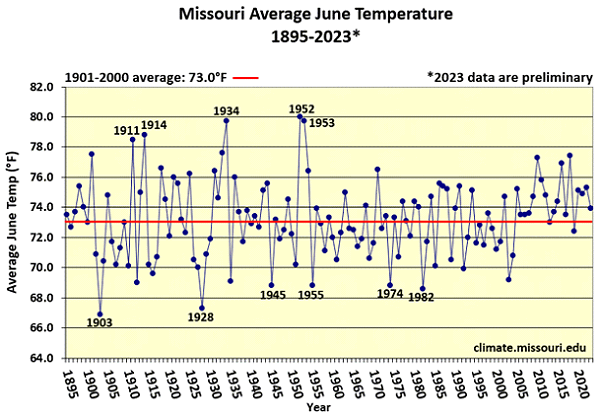
Figure 2.
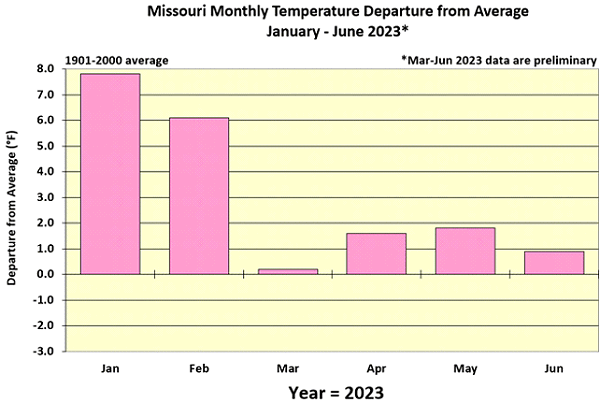
Figure 3.
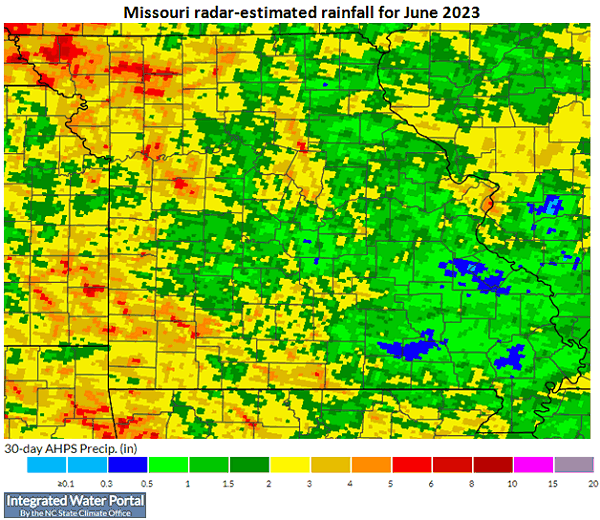
Figure 4.
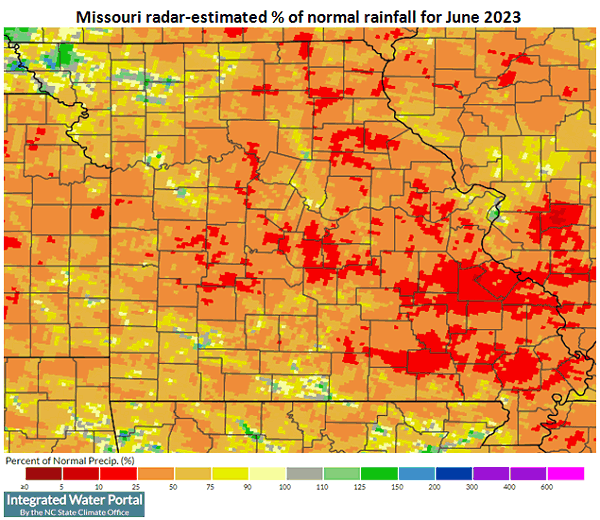
Figure 5.
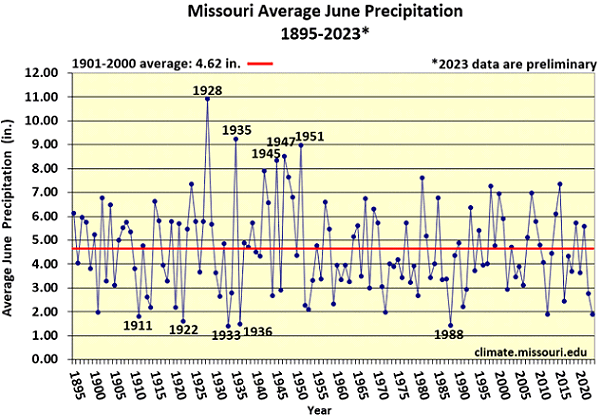
Figure 6.
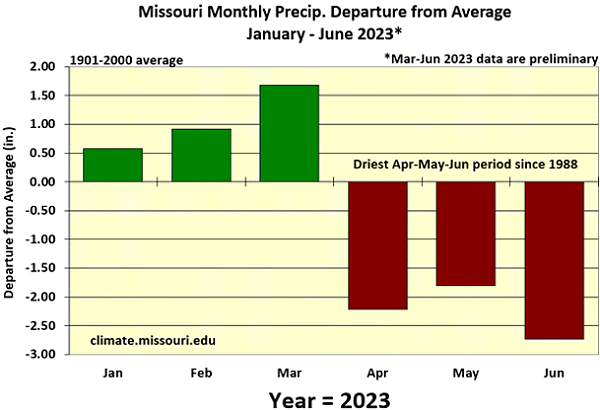
Figure 7.
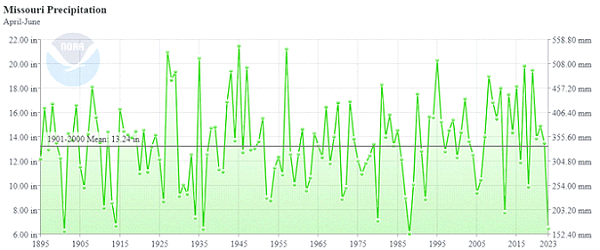
Figure 8.
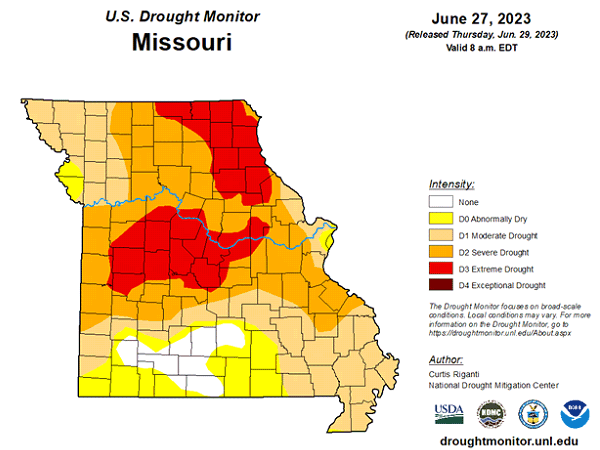
Figure 9.
Source: Dr. Pat Guinan, 573-882-5908


