
August 2017 Weather and Its Impacts on Missouri
Pat Guinan
State Climatologist
Commercial Agriculture/University of Missouri Extension
A significant pattern change to cooler weather began during the last week of July and persisted into much of August. With only a few exceptions, most days averaged cooler than normal for the month, Figure 1. Preliminary data indicate the statewide average temperature for August was 72.0, or 4.1 degrees below normal. It was the 7th coolest August on record and coolest August since 2004, Figure 2. The last time a month had a greater cooler departure was in February 2015, Figure 3.
Despite June and July temperatures averaging slightly above normal, the unusual August coolness resulted in a summer temperature average of 74.7°F, which is 0.9°F below the long-term summer average temperature. Four out of the five past summers have been cooler than average, Figure 4.
August rainfall was variable but preliminary data indicate a statewide average of 5.25 inches, or 1.55 inches above the long-term average. It was the only summer month averaging above normal, Figure 5, and it was the fifth consecutive wetter than average August, Figure 6. Notable precipitation variability for the month translated to some areas experiencing drier than normal conditions. Figure 7 is a radar image of estimated rainfall for August, and shows wettest and driest parts of the state. Some counties in east central and southeastern Missouri reported less than 2-inches for the month, whereas 10 or more inches were observed over portions of west central and southwestern Missouri.
An extreme rain event impacted portions of west central and south central Missouri on Aug 5-6 when 4-8.5 inches fell over a corridor extending from Jackson to Pulaski Counties. Another extreme event impacted west central Missouri on Aug 21-22 with 5-8 inches reported from Platte and Clay counties southward through Jackson and Cass counties. Parts of west central Missouri experienced 3 major flood events since the beginning of June.
It was a summer with highly variable rainfall across the Show Me State, ranging from flood to drought, Figure 8. Some counties in west central Missouri received greater than 25-inches for the Jun-Aug period. The highest total came from a CoCoRaHS report in Clay County, just northwest of Pleasant Valley, where 31.24 inches was observed. Alternatively, some of the lowest rainfall totals were found on the eastern side of Missouri, especially in an area south and southwest of St. Louis, where less than 6-inches were observed for the summer.
Frequent rain events were few and far between across the state and resulted in many locations experiencing occasional droughty conditions. There were several instances where a timely rain event ended a lengthy dry spell. As August came to an end, driest summer conditions were found across far northern and east central parts of Missouri, Figure 9.
According to the Missouri Agricultural Statistics Service report for the week ending August 27, 2017, 76% of the state reported topsoil moisture supplies in adequate to surplus condition. Similarly, 74% of the subsoil moisture supplies were in adequate to surplus condition. Corn was reported 62% in good to excellent condition compared to 76% at the same time last year. Soybean was 64% in good to excellent condition compared to 73% last year. Pastures were rated at 61% in good to excellent condition compared to 67% last year. Hay and other roughages were 95% adequate to surplus, similar to last year.
The autumn outlook (Sep-Oct-Nov) issued on August 17, 2017, by the Climate Prediction Center, indicates an enhanced likelihood of above normal temperatures over all of Missouri, Figure 10. There are equal chances for above, below and near average precipitation for the northern half of the Show Me State with a higher likelihood for above normal precipitation over the southern half of the state, Figure 11.
A once in a lifetime experience occurred just after solar noon on August 21, 2017 when a total solar eclipse swept across Missouri, Figures 12-17.
Jump to:
- Figure 1
- Figure 2
- Figure 3
- Figure 4
- Figure 5
- Figure 6
- Figure 7
- Figure 8
- Figure 9
- Figure 10
- Figure 11
- Figure 12
- Figure 13
- Figure 14
- Figure 15
- Figure 16
- Figure 17
- Figure 18
- Figure 19
- Figure 20
- Figure 21
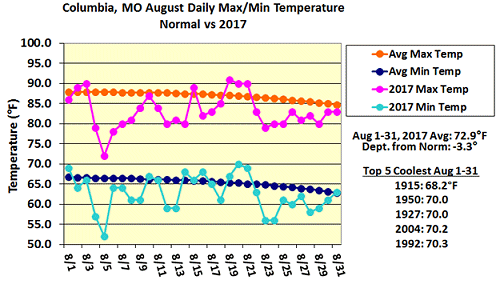
Figure 1.
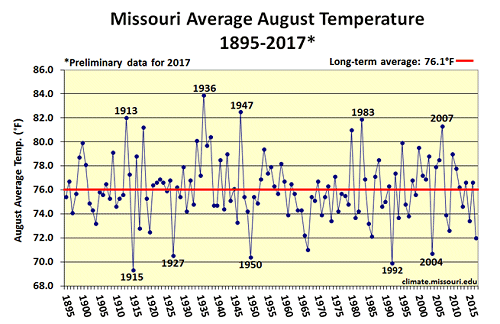
Figure 2.
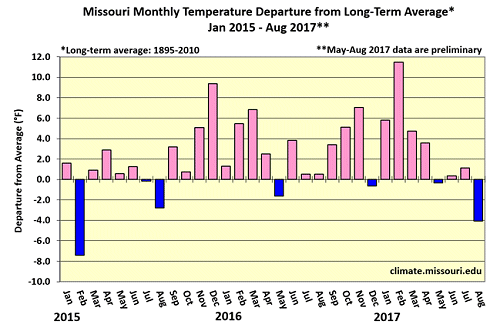
Figure 3.
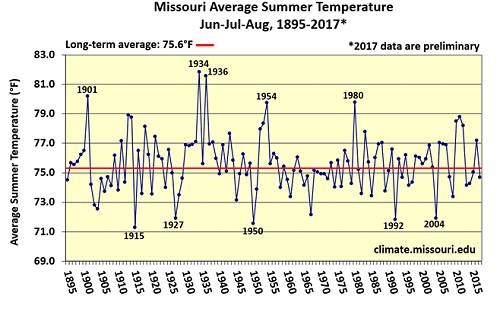
Figure 4.
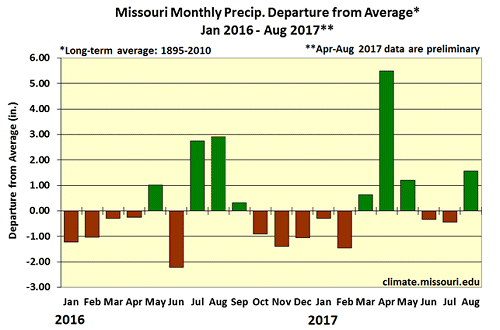
Figure 5.
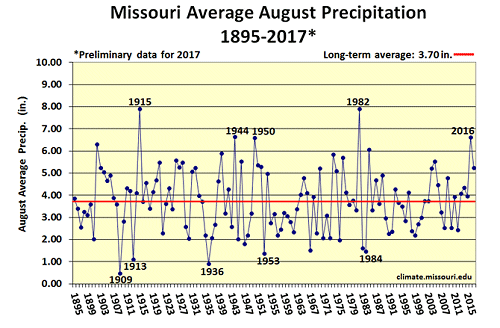
Figure 6.
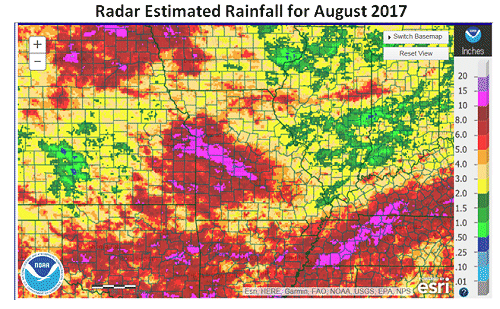
Figure 7. Radar Estimated Rainfall for August 2017
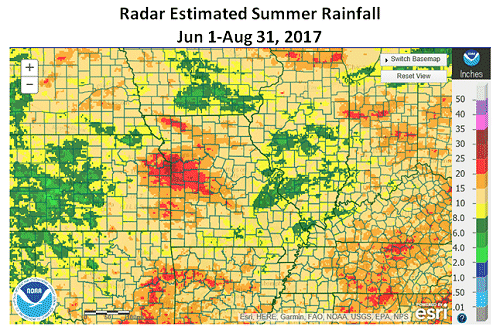
Figure 8. Radar Estimated Summer Rainfall Jun 1-Aug 31, 2017
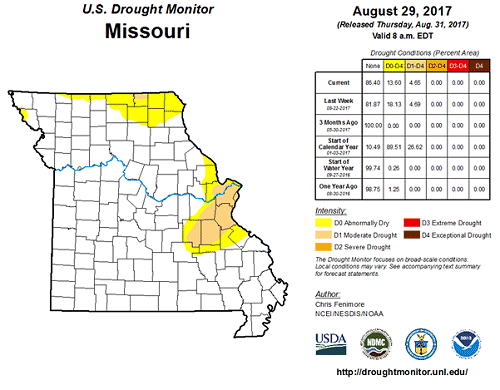
Figure 9.
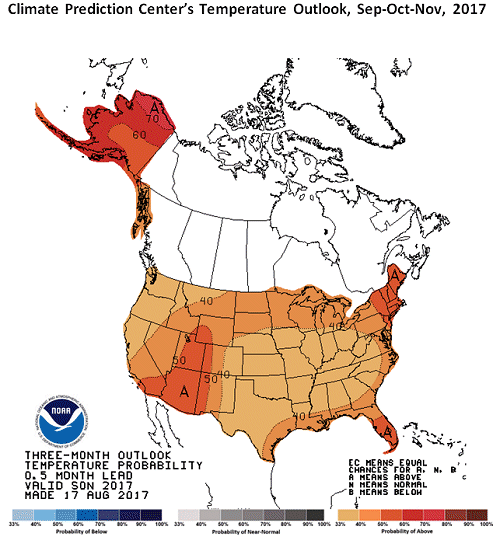
Figure 10. Climate Prediction Center’s Temperature Outlook, Sep-Oct-Nov, 2017
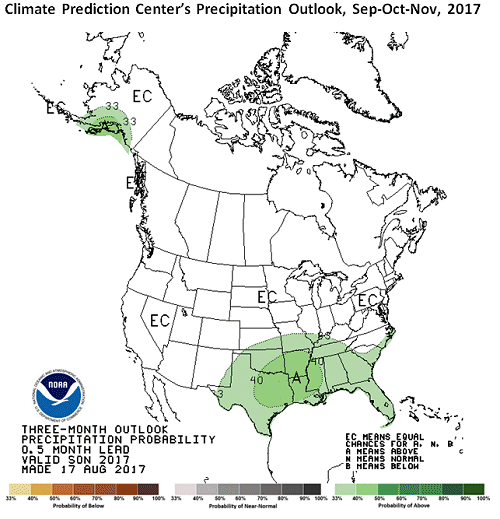
Figure 11. Climate Prediction Center’s Precipitation Outlook, Sep-Oct-Nov, 2017
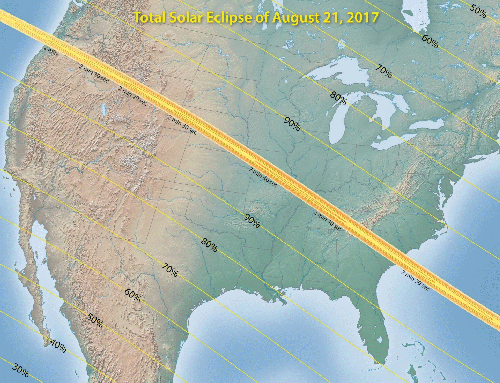
Figure 12.
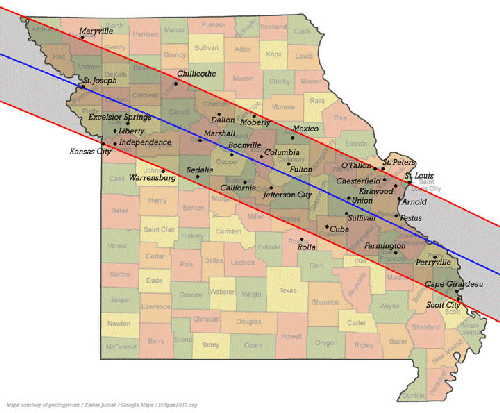
Figure 13. Total Solar Eclipse of August 21, 2017
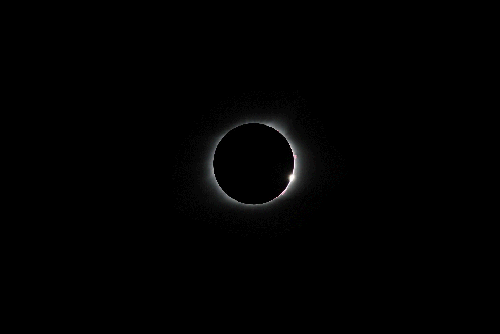
Figure 14.Total solar eclipse at Concordia, Missouri, Aug 21, 2017. Photo taken by Tim Baker.
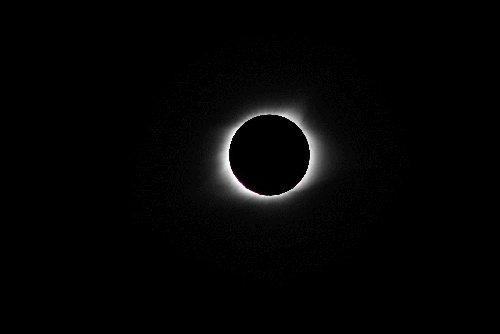
Figure 15.Total solar eclipse at Concordia, Missouri, Aug 21, 2017. Photo taken by Tim Baker.
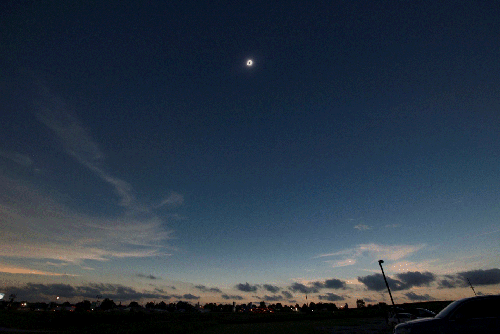
Figure 16.Total solar eclipse at Concordia, Missouri, Aug 21, 2017. Photo taken by Tim Baker.
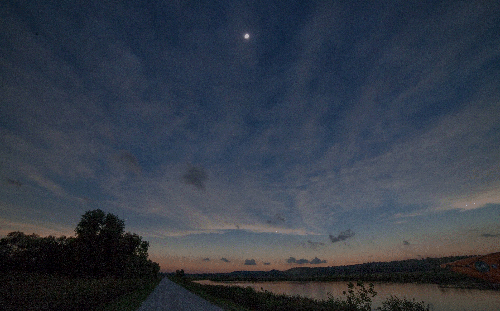
Figure 17.Total solar eclipse at Eagle Bluffs Conservation Area, Boone Co., MO, Aug 21, 2017. Photo taken by Charles Baerwald.
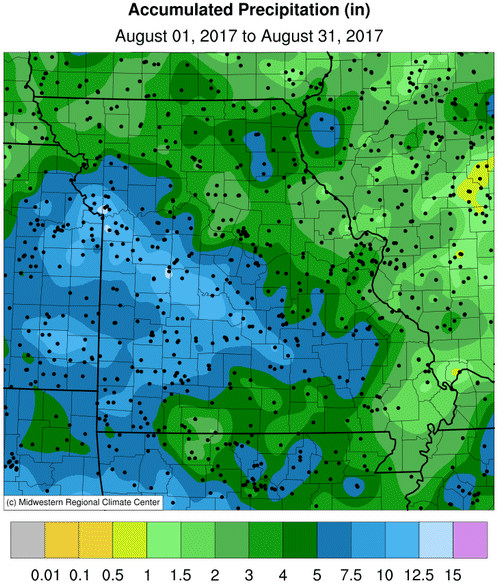
Figure 18.
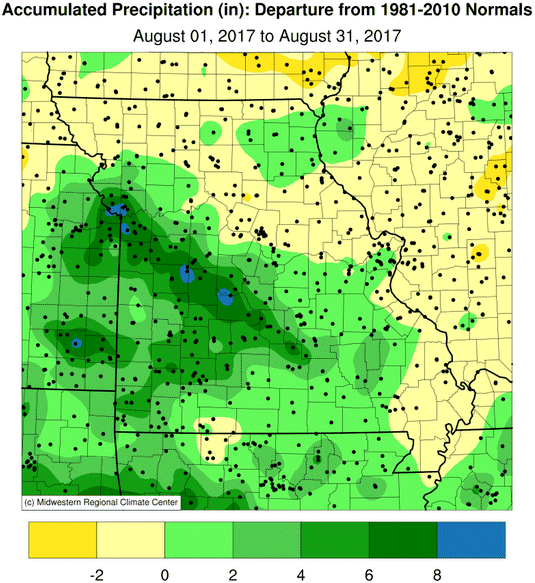
Figure 19.
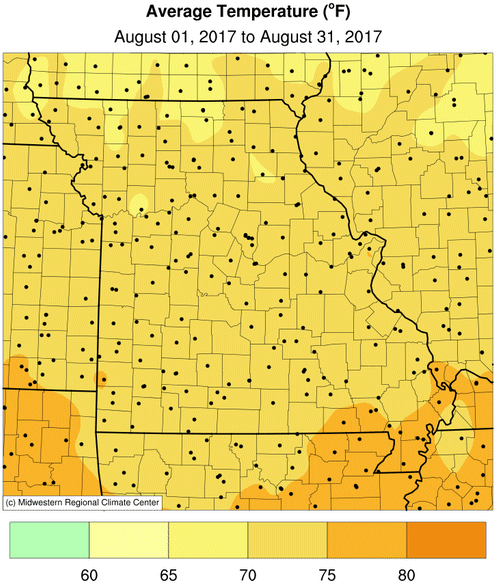
Figure 20.
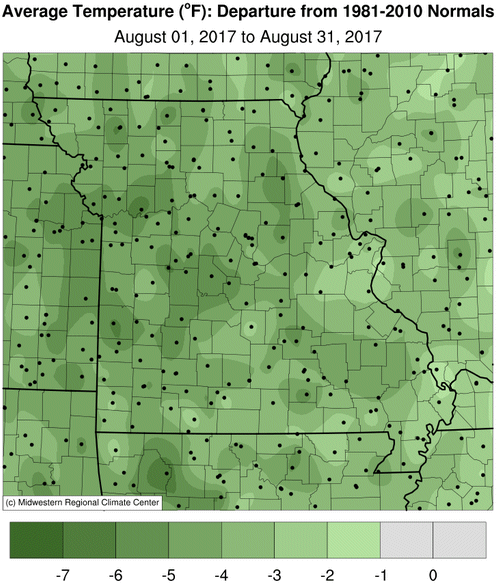
Figure 21.
Source: Pat Guinan, 573-882-5908